 Green Room
The Greenroom app
Greenroom
Greenroom shows our clients their own Instagram, TikTok, YouTube and Facebook numbers in one place: views, followers and engagement over time, which posts and themes work best, when their audience is around, and a live media kit to send sponsors.
InstagramTikTokYouTubeFacebook
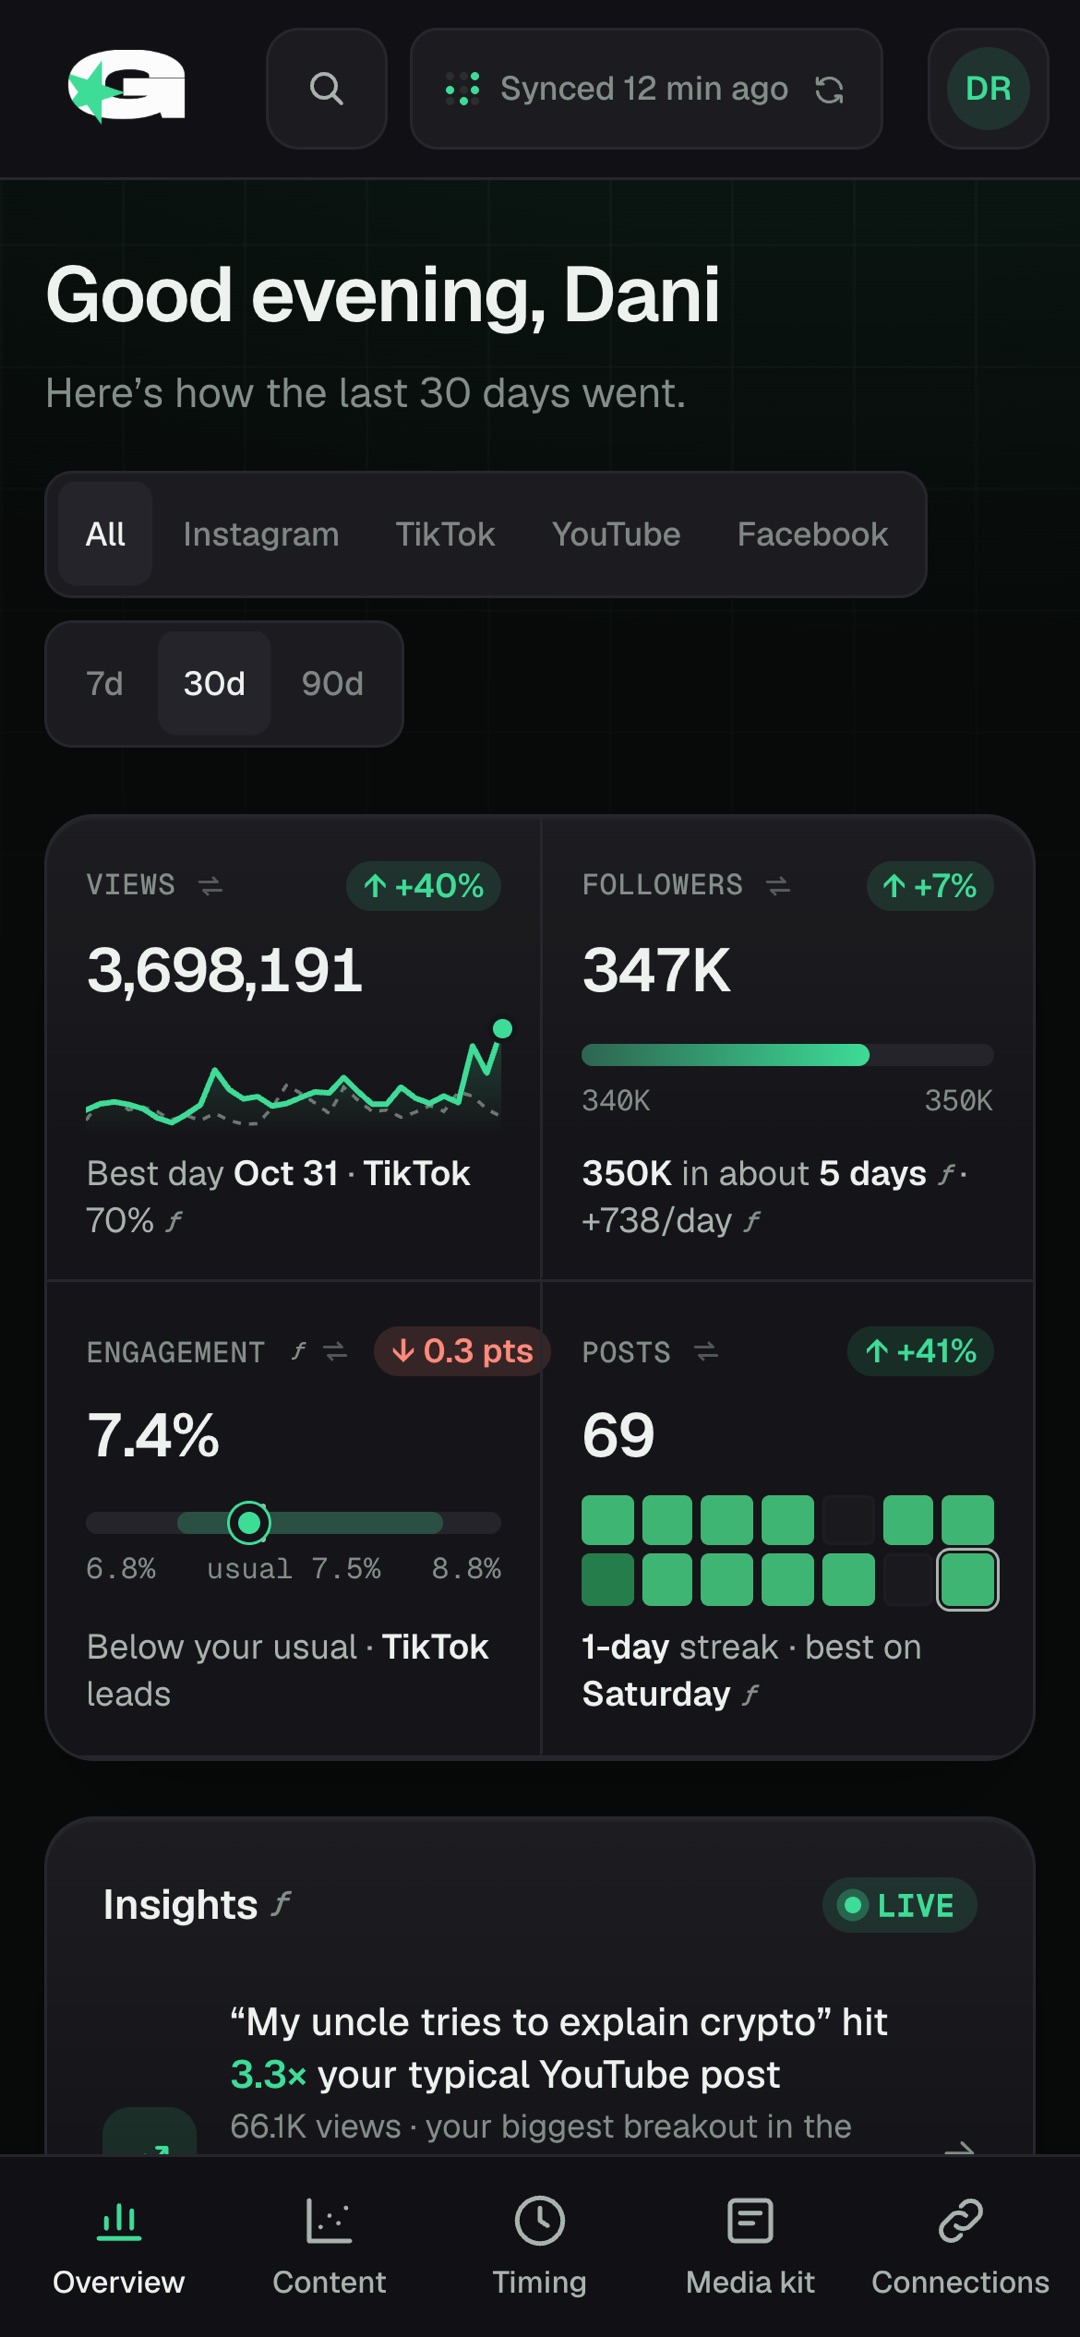
All four platforms
Instagram, TikTok, YouTube and Facebook on one screen.
Views, followers, engagement and posts across every account you connect, for the last 7, 30 or 90 days. See them together or one platform at a time, and tap any number to see which platform it came from.
- 7, 30 or 90 days
- Tap a number for the split
- Refreshes every few hours

Every post vs your typical post
Know which posts beat your usual, and by how much.
Each post is measured against your typical post on the same platform, the median of your last 90 days. 5.2× means five times your usual. Posts at 2× or more are marked as breakouts, and each post shows what shaped it: its theme, its time slot and its engagement.
- Typical = your 90-day median ƒ
- 2× or more = breakout
- Reach vs engagement map

Themes
See which subjects your audience wants more of.
Greenroom groups your posts by the hashtags you use again and again, then shows how each theme does against your typical post. Tap a theme to see its posts.
- From your own hashtags
- Ranked against your typical post ƒ

Best time to post
Post when your audience shows up.
Your best day, your three strongest time windows and a week-at-a-glance grid, in your own time zone and based on your last 90 days. A window with fewer than three posts stays blank instead of guessing.
- Your time zone
- Last 90 days
- Blank under 3 posts

Live media kit
A media kit that keeps itself up to date.
Publish one link for brands with your audience, platform breakdown, top posts, past partners and a button to reach you. The numbers update on their own, and you can download a PDF any time.
- app.teamgreenroom.com/k/you
- Download as PDF
- Pick and order sections

Insights and the Monday email
Your week in plain English, every Monday.
Greenroom turns your numbers into short insights, each with a next step, and keeps them on your Overview. Every Monday morning you also get a short summary by email: last week’s views, followers, your top post and a few tips, with one-click unsubscribe.
- Every Monday morning
- A few tips for the week
- One-click unsubscribe

Read-only and private
Read-only. Your numbers stay yours.
- You connect through each platform’s own login. Greenroom never sees your password.
- Greenroom only reads. It never posts, comments, messages or changes anything.
- Only you see your numbers, plus anyone you send a published media kit.
- We don’t sell your data or use it for advertising.
- Insights come from fixed rules, not AI, and we don’t use your data to train AI models.
- Disconnect a platform or delete your account any time.

ƒ = Greenroom calculation, not YouTube or platform data.
How it works
- Sign in with your Google account. Greenroom is for Green Room clients, by invite.
- Connect the accounts you want to see. Each one opens that platform’s own login, where you approve read-only access. Greenroom never sees your password.
- Greenroom pulls in your last 90 days of posts and refreshes your numbers every few hours.
What Greenroom reads, and why
Greenroom only reads. It never posts, comments, messages or changes anything on your accounts, and it only shows your numbers to you, plus anyone you share a published media kit with.
Google sign-in
Your name, email address and profile photo, to create your Greenroom account and show whose it is.
YouTube
Your channel name, subscriber count and each video’s title, description, date, views, likes and comments (YouTube Data API, read-only), plus your channel’s daily views and subscriber changes (YouTube Analytics API, read-only). Greenroom uses them to chart your views and subscribers over time, compare each video with your typical one, and fill in your media kit.
For Creator and Business accounts: your username, follower count, and each post’s caption, date, link, likes, comments and views. Used for the same charts, post comparisons, posting-time insights and media kit.
TikTok
Your username, display name and follower count, and each video’s caption, date, link, views, likes and comments.
For a Page you manage: its name, follower count and daily views, and each post’s text, date, link, views, reactions and comments.
Your data
Greenroom doesn’t sell your data or use it for advertising. Disconnect a platform or delete your account at any time in Greenroom’s Connections page; see how to delete your data. Full details are in our privacy policy and terms of service. Greenroom’s use of information received from Google APIs adheres to the Google API Services User Data Policy, including the Limited Use requirements.
Contact
Greenroom is made by Green Room Productions, based in Austin, Texas, for creators in Albuquerque and beyond. Email hello@teamgreenroom.com.